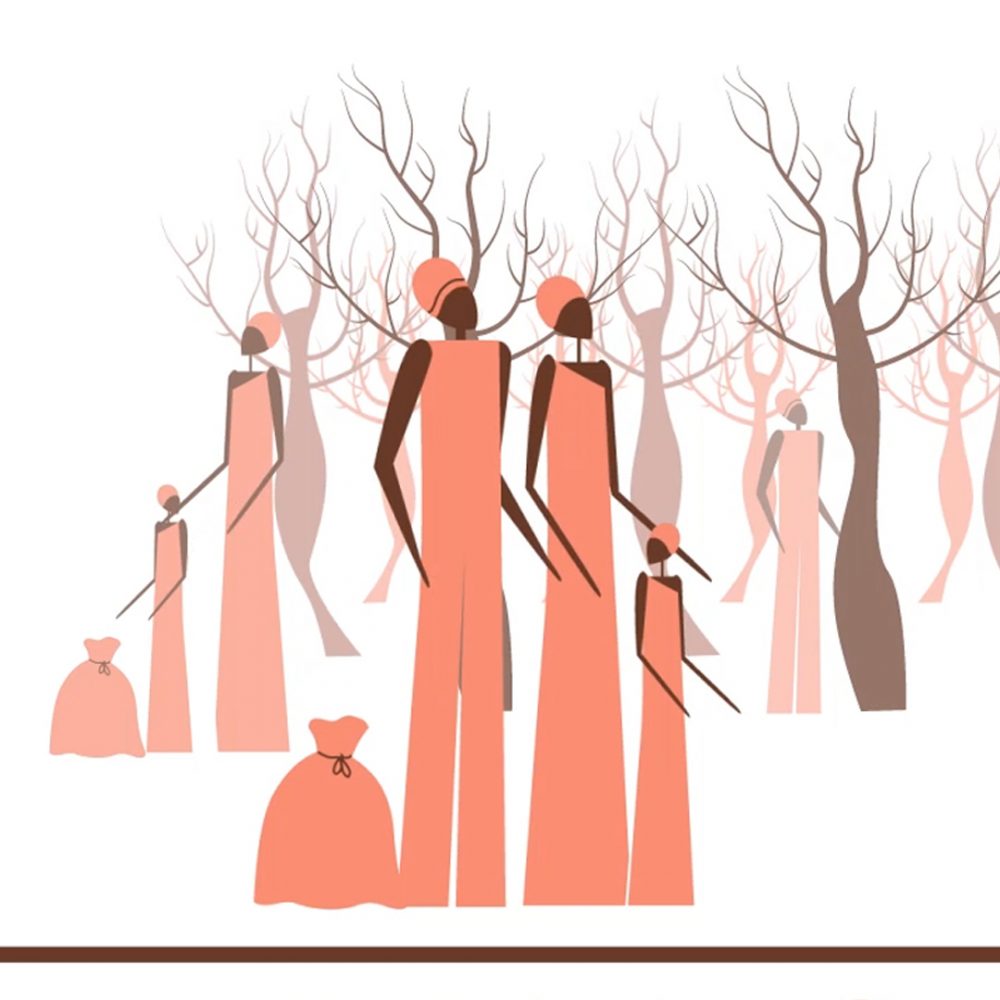
This animation focuses on how Results Based Financing is applied to education. Through motion graphics, we describe the links established between donors, national institutions, service providers, and clients in order to engage communities and make access to quality services more efficient, transparent and inclusive.
MOTION GRAPHICS PORTFOLIO
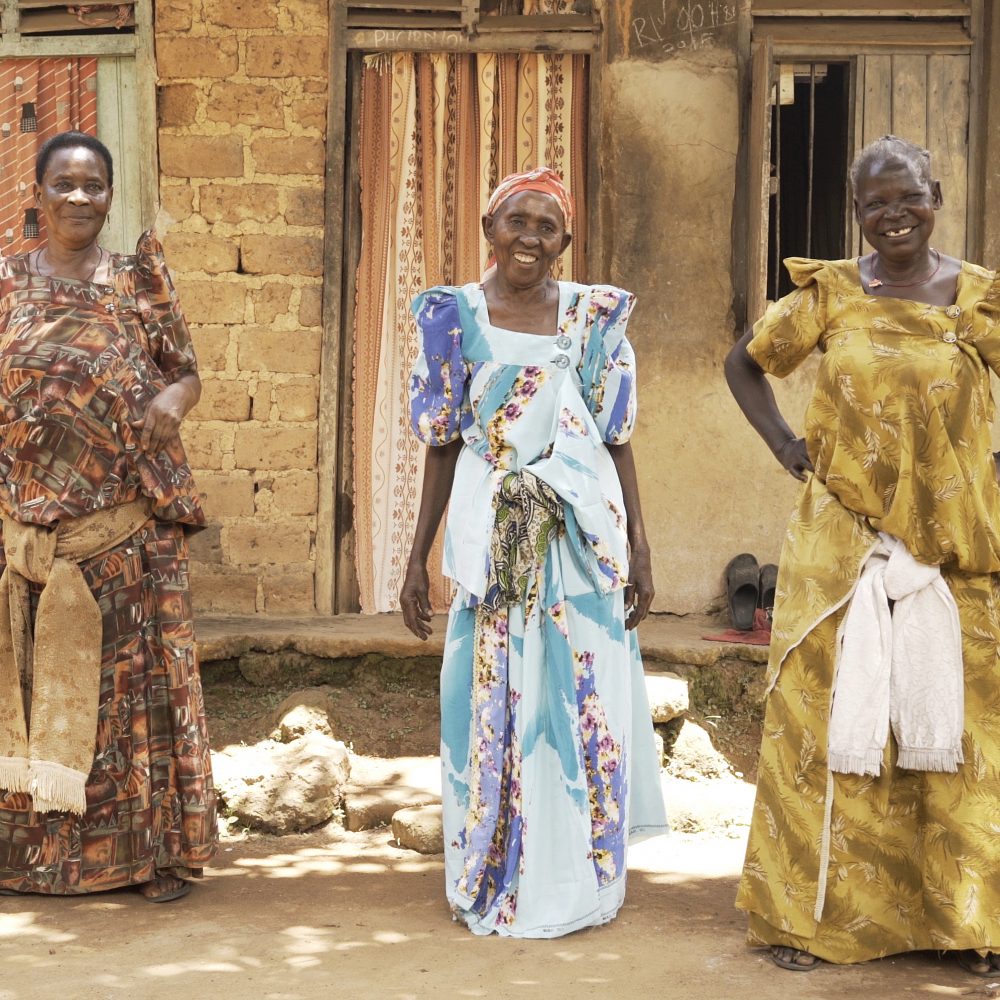
Summarizing concepts, explaining processes, and communicating findings

MAKING COMPLEX CONCEPTS ACCESSIBLE
Using motion graphics to explain RBF methodology

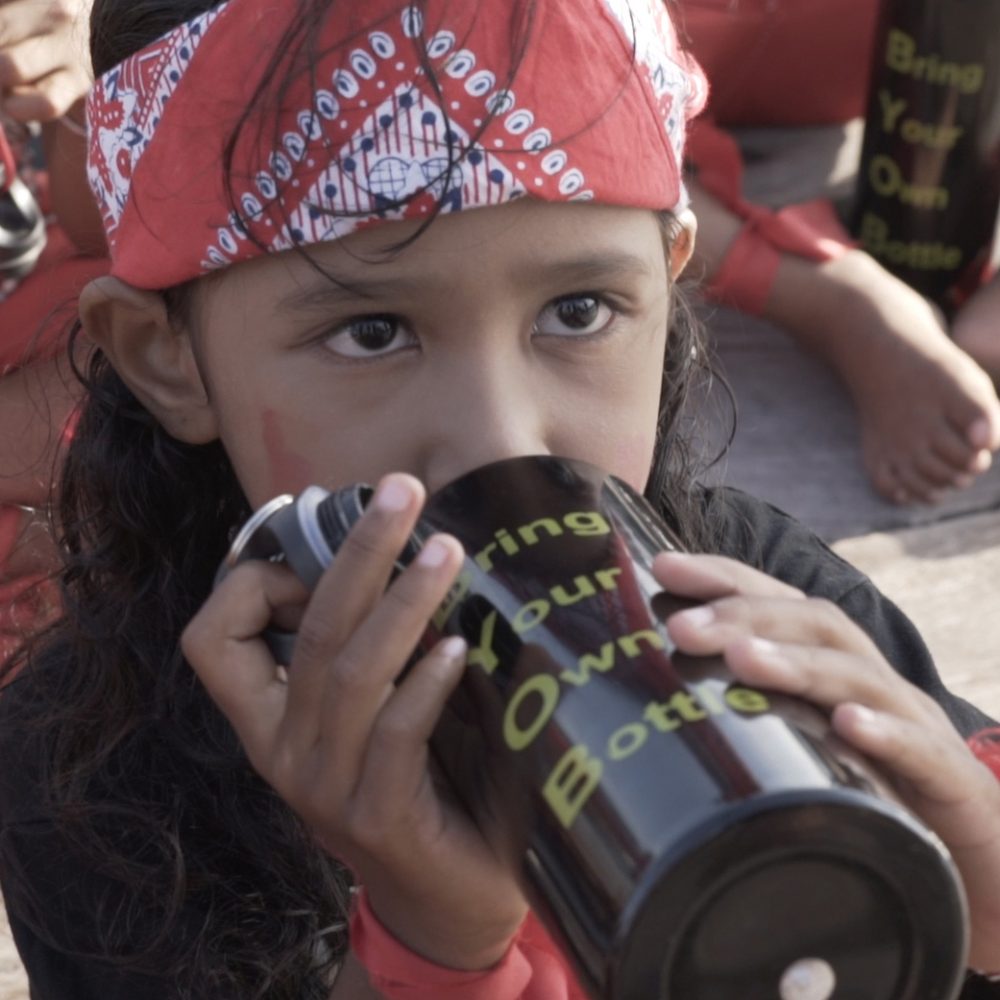
EXPLAINING PROCESSES
Presenting the logic behind an intervention

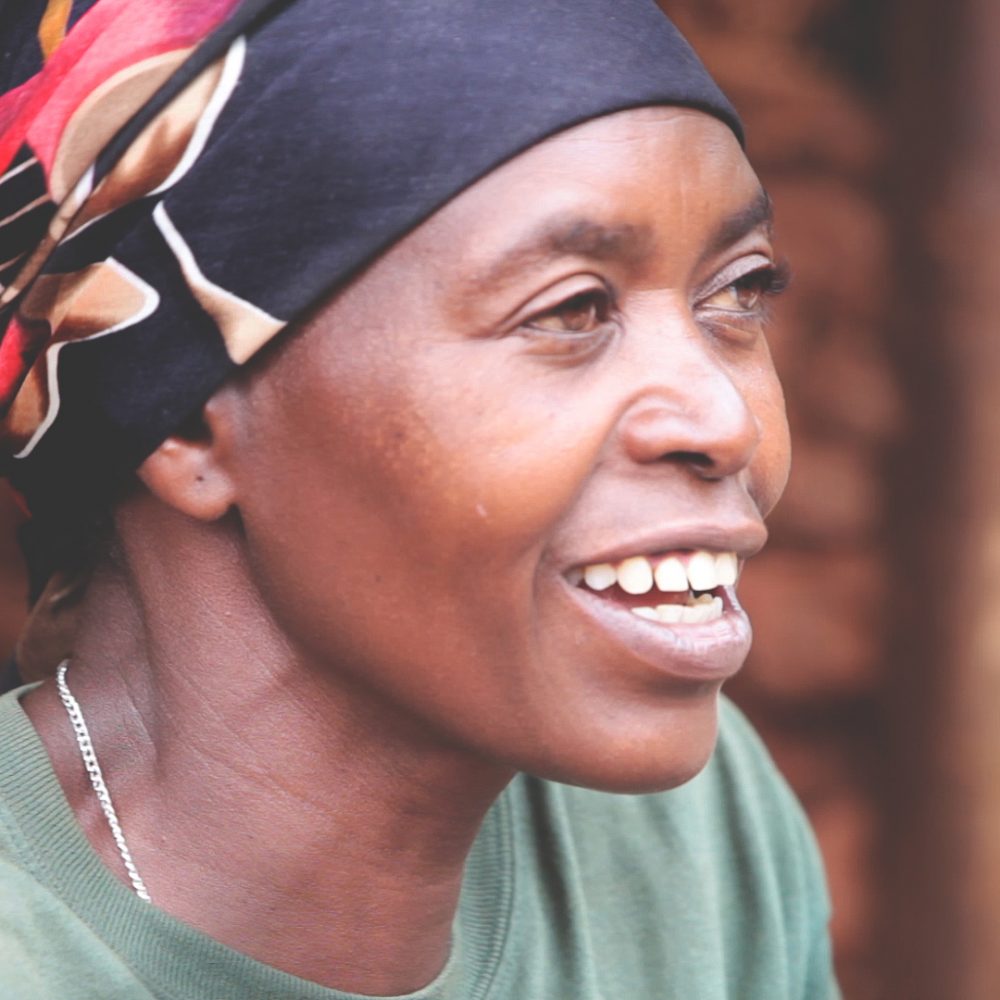
DEPICTING EVALUATION RESULTS
Enhancing the use and impact of written reports
WATCH MORE OF OUR WORK
Visuals that tell stories from the inside


MOTION GRAPHICS
MAKING COMPLEX CONCEPTS ACCESSIBLE